
WORK / BANQU
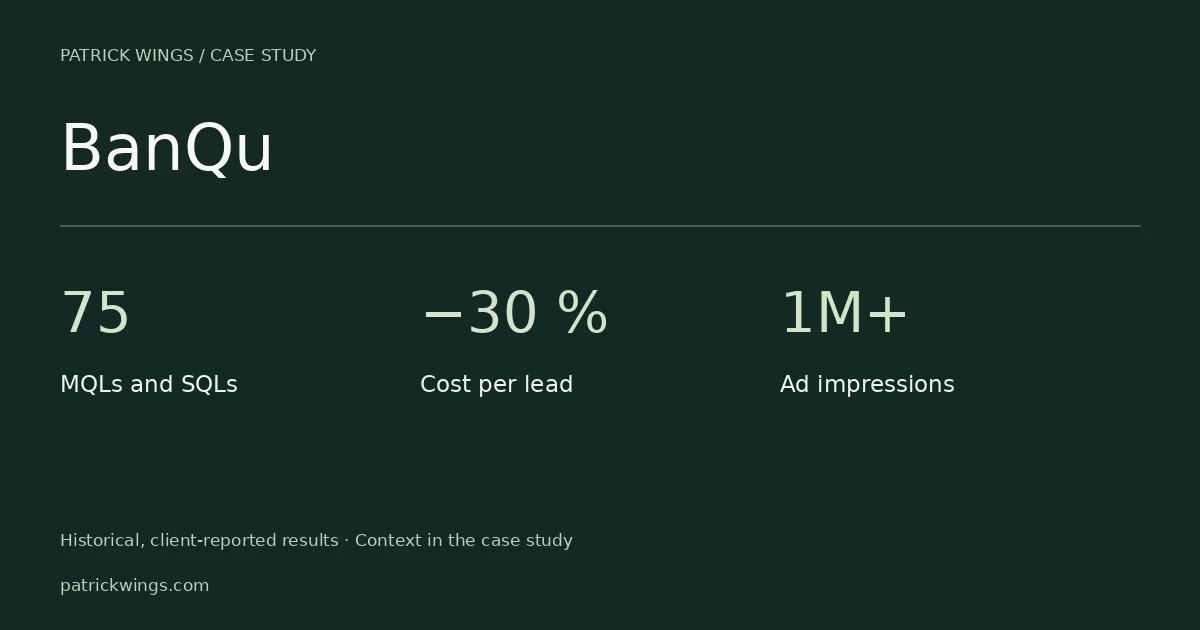
BanQu: 75 MQLs and SQLs with 30 percent lower CPL
From missing campaign infrastructure to a connected paid-demand system: the engagement supported BanQu’s European expansion with strategy, localisation, campaigns, tracking and structured sales handoff.
MQLs and SQLs
Combined reported lead figure; no separate stage counts.
Cost per lead
Reduction across Google and LinkedIn campaigns.
Ad impressions
14 campaigns and 80 ads, as reported.
Historical, client-reported results. Measurement limits are explained in the case.
The approach at a glance
- 01
approx. 2 months
Foundation
Personas, goals, localisation, conversion paths, keyword research and privacy documentation.
- 02
1 month
Campaign setup
Multilingual landing pages, Google and LinkedIn ads, full-funnel content and tracking.
- 03
3+ months
Launch & optimisation
Paid reach, capture, email nurture, daily lead handoff and reporting every two weeks.
The starting point: EU growth without a complete lead system
BanQu is a blockchain-based supply-chain traceability platform supporting transparency, compliance and accountability in global supply chains. European growth required greater paid reach and more qualified contacts.
A small internal marketing team could not execute all required initiatives itself. Experience with lead ads across platforms and markets was limited. A comprehensive lead-generation strategy and actionable launch plan were missing. Localised journeys, multilingual assets and tracking also needed preparation.
The mandate: additional capacity and a repeatable system
BanQu brought in GROWSaaS as a strategy and execution partner. Paid reach needed to expand across EU markets and translate into more MQLs and SQLs through precise targeting and effective conversion paths.
The brief extended beyond a single advertising campaign. The goal was a connected system from audience definition and a localised website through campaigns, nurture and sales handoff. Establishing the foundations was therefore a distinct phase before activation.
Phase 1: prepare audiences and European journeys
The team first defined target personas and concrete campaign objectives. German, French and Spanish website versions extended the offer. Conversion paths were adapted to European audiences, while keyword research connected content with relevant organic EU search topics.
The source also mentions implementing GDPR documentation. This is a reported project activity, not independent evidence of complete compliance. Approximately two months of preparation produced a LinkedIn-specific lead-generation strategy connecting awareness, engagement and qualified conversion.
Phase 2: connect landing pages, ads and measurement
Campaign preparation took one month according to the reference. Multilingual landing pages aimed to improve relevance and user experience for European audiences. Google and LinkedIn ads were prepared together with conversion tracking.
TOFU, MOFU and BOFU content addressed different information and decision stages. Google Analytics and Leadfeeder supported the reported measurement and identification setup. Those tools belong to the historical engagement; their suitability elsewhere requires a fresh assessment of goals and requirements.
Phase 3: connect paid reach with nurture and sales
Google Search and LinkedIn targeted enterprise and mid-market prospects. Conversion-focused pages and introductory content connected attention with lead capture. Email and newsletter programmes nurtured contacts.
Leads were delivered to sales daily. Reporting every two weeks and ongoing optimisation connected campaign learning with sales follow-up. The activation phase is described as three or more months. That is a process duration, not necessarily the measurement period for every individual metric.
Results: more demand at a lower lead cost
The results overview reports more than one million ad impressions from 14 campaigns and 80 ads. It reports 75 MQLs and SQLs for the sales team and a 30 percent CPL reduction across Google and LinkedIn campaigns. LinkedIn click-through rates reached up to 1.08 percent.
Lead volume progressed from around ten per month to the reported figure of 75 within three months. The source does not clearly establish whether 75 is a final monthly rate or a cumulative period total. No monthly growth rate is therefore calculated from it.
Measurement context and client perspective
MQLs and SQLs are reported as a combined figure. This is neither doubled into 75 MQLs plus 75 SQLs nor presented as 75 customer wins. An absolute CPL, total budget and market breakdown are not supplied either. The source therefore does not support CAC, ROAS or revenue calculations.
Jordan Wilson, Director of Digital Marketing at BanQu, highlights support from Patrick, Arno and the team with Google and LinkedIn ads, together with execution and content quality. The practical lesson is the sequence: establish foundations, prepare campaigns and measurement, then optimise with nurture and sales feedback.
Documentation & measurement context
GROWSaaS BanQu Case Study 2026, German client reference. Results: page 8; feedback from Jordan Wilson: page 9.
The figures document historical project results. Missing data is not replaced by assumptions. A new engagement receives its own objectives, definitions and measurement criteria.
Frequently asked questions
How many leads were reported for BanQu?
The reference reports 75 MQLs and SQLs combined. Separate counts by stage and a clearly defined final monthly rate are not supplied.
Which languages were prepared?
The source names German, French and Spanish website versions and multilingual landing pages for European audiences.
Which channels were involved?
Google Search and LinkedIn were connected with landing pages, content, email nurture and structured sales handoff.
Does 30 percent lower CPL establish lower CAC?
No. CPL measures lead costs; CAC concerns acquired customers and the costs included. The reference does not provide a CAC calculation.
How can I tell whether a project is relevant to our marketing challenge?
Compare audience, market, starting point and the specific task with your situation first. Then review the described activities and metrics. A similar industry alone is not enough to expect the same results or timeline.
FROM IDEA TO EXECUTION